detectors is an R data package containing predictions
from various GPT detectors. The data is based on the paper:
GPT Detectors Are Biased Against Non-Native English Writers. Weixin Liang, Mert Yuksekgonul, Yining Mao, Eric Wu, James Zou. CellPress Patterns.
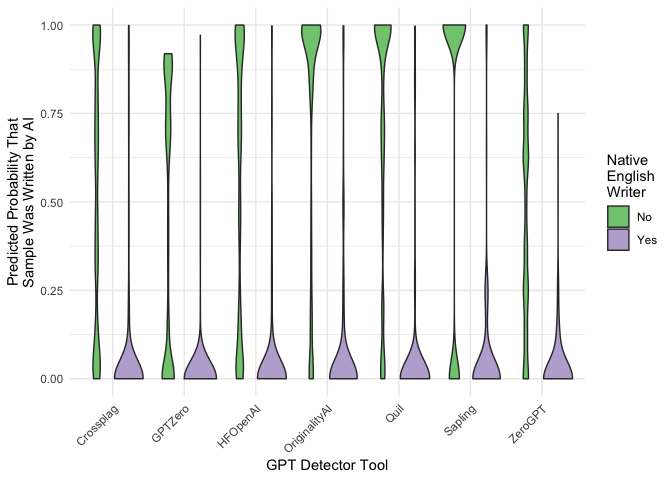
The study authors carried out a series of experiments passing a number of essays to different GPT detection models. Juxtaposing detector predictions for papers written by native and non-native English writers, the authors argue that GPT detectors disproportionately classify real writing from non-native English writers as AI-generated.
You can install the data package with the following code:
require(pak)
pak("simonpcouch/detectors")Taking a look at the data:
library(ggplot2)
library(detectors)

detectors
## # A tibble: 6,185 × 9
## kind .pred_AI .pred_class detector native name model document_id prompt
## <fct> <dbl> <fct> <chr> <chr> <chr> <chr> <dbl> <chr>
## 1 Human 1.00 AI Sapling No Real… Human 497 <NA>
## 2 Human 0.828 AI Crossplag No Real… Human 278 <NA>
## 3 Human 0.000214 Human Crossplag Yes Real… Human 294 <NA>
## 4 AI 0 Human ZeroGPT <NA> Fake… GPT3 671 Plain
## 5 AI 0.00178 Human Originality… <NA> Fake… GPT4 717 Eleva…
## 6 Human 0.000178 Human HFOpenAI Yes Real… Human 855 <NA>
## 7 AI 0.992 AI HFOpenAI <NA> Fake… GPT3 533 Plain
## 8 AI 0.0226 Human Crossplag <NA> Fake… GPT4 484 Eleva…
## 9 Human 0 Human ZeroGPT Yes Real… Human 781 <NA>
## 10 Human 1.00 AI Sapling No Real… Human 460 <NA>
## # ℹ 6,175 more rowsAn example plot demonstrates the distributions of predicted probabilities that a text sample was written by AI depending on the GPT detector model and lived experience in writing English of the author:
detectors_plot <-
  detectors[!is.na(detectors$native), ] %>%
  ggplot() +
  aes(x = detector, y = .pred_AI, fill = native) +
  geom_violin(bw = .05) +
  labs(
    x = "GPT Detector Tool",
    y = "Predicted Probability That\nSample Was Written by AI",
    fill = "Native\nEnglish\nWriter"
  ) +
  theme_minimal() +
  scale_fill_brewer(type = "qual") +
  theme(axis.text.x = element_text(angle = 45, vjust = 1, hjust = 1))

detectors_plot