![]()
In online A/B testing, we often face a significant practical challenge: the randomization unit differs from the analysis unit. Typically, control and treatment groups are randomly assigned at the user level, while metrics—such as click-through rate—are measured at a more granular level (e.g., per page-view). In this case, the randomization unit is user, but the analysis unit is page-view.
This discrepancy raises concerns for statistical hypothesis testing, which assumes that data points are independent and identically distributed (i.i.d.). Specifically, a single user can generate multiple page-views, and each user may have a different probability of clicking. Consequently, the data may exhibit within-user correlation, thereby violating the i.i.d. assumption.
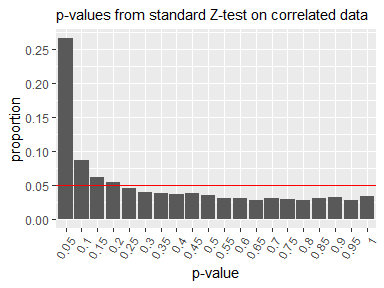
When the standard Z-test is applied to such correlated data, the resulting p-values do not follow the expected uniform distribution under the null hypothesis. As a result, smaller p-values tend to occur more frequently even when there is no true difference, increasing the risk of falsely detecting a significant difference.
To address this problem, Deng et al. (2018) proposed a modified statistical hypothesis testing method. Their approach replaces the standard variance estimation formula in the Z-test with an approximate formula derived via the Delta method, which accounts for within-user correlation. To simplify the application of this method, the deltatest package has been developed.
To illustrate how to use this package, we prepare a data frame that includes columns for the number of clicks and page-views aggregated for each user. This data frame also contains a column indicating whether each user was assigned to the control or treatment group.
library(dplyr)

n_user <- 2000

set.seed(314)
data <- deltatest::generate_dummy_data(n_user) |>
  mutate(group = if_else(group == 0, "control", "treatment")) |>
  group_by(user_id, group) |>
  summarise(clicks = sum(metric), pageviews = n(), .groups = "drop")

data
#> # A tibble: 2,000 × 4
#>    user_id group     clicks pageviews
#>      <int> <chr>      <int>     <int>
#>  1       1 treatment      1         6
#>  2       2 treatment      2        11
#>  3       3 control        0        17
#>  4       4 control        4        12
#>  5       5 control        5        10
#>  6       6 control        1        15
#>  7       7 control        2         6
#>  8       8 treatment      2        11
#>  9       9 treatment      2        16
#> 10      10 control        0        17
#> # ℹ 1,990 more rows
The statistical hypothesis test using the Delta method can then be performed on this data as follows:
library(deltatest)
deltatest(data, clicks / pageviews, by = group)
#>
#> Two Sample Z-test Using the Delta Method
#>
#> data: clicks/pageviews by group
#> Z = 0.31437, p-value = 0.7532
#> alternative hypothesis: true difference in means between control and treatment is not equal to 0
#> 95 percent confidence interval:
#> -0.01410593 0.01949536
#> sample estimates:
#> mean in control mean in treatment difference
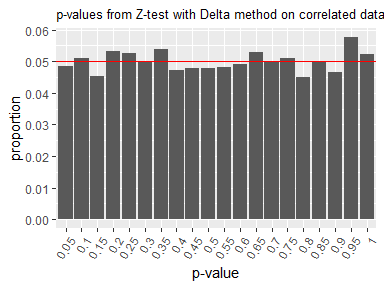
#> 0.245959325 0.248654038 0.002694713This version of the Z-test yields p-values that follow the expected uniform distribution under the null hypothesis, even when within-user correlation is present.
You can install the deltatest package from CRAN.
install.packages("deltatest")You can also install the development version from GitHub with:
# install.packages("remotes")
remotes::install_github("hoxo-m/deltatest")The deltatest package provides the
deltatest function for performing statistical hypothesis
tests using the Delta method as proposed by Deng et al. (2018). In this
section, we explain the function’s arguments and its return value.
data ArgumentTo run deltatest, you need to prepare an appropriately
aggregated data frame. This data frame must include columns for the
numerator and denominator of your metric, aggregated for each
randomization unit (typically, each user). For example:
Note that the denominator should match the analysis unit.
The deltatest package provides the
generate_dummy_data function to create dummy data. It
generates metric values per page-view, so you need to aggregate the data
by user.
library(dplyr)

n_user <- 2000

set.seed(314)
data <- deltatest::generate_dummy_data(n_user) |>
  group_by(user_id, group) |>
  summarise(clicks = sum(metric), pageviews = n(), .groups = "drop")

data
#> # A tibble: 2,000 × 4
#>    user_id group clicks pageviews
#>      <int> <int>  <int>     <int>
#>  1       1     1      1         6
#>  2       2     1      2        11
#>  3       3     0      0        17
#>  4       4     0      4        12
#>  5       5     0      5        10
#>  6       6     0      1        15
#>  7       7     0      2         6
#>  8       8     1      2        11
#>  9       9     1      2        16
#> 10      10     0      0        17
#> # ℹ 1,990 more rows
This data frame includes the user_id column, but this
column is not required to run deltatest.
formula and
by ArgumentsThe second argument, formula, and the third argument,
by, specify which columns in the data frame represent the
numerator, denominator, and group. There are three input styles
available for the formula argument.
This is the common formula format, where the left-hand side
represents the target variable, and the right-hand side specifies the
explanatory variable. In this case, the left-hand side should be of the
form numerator / denominator, and the right-hand side
should be the column name representing the group. When using this style,
you do not need to specify the by argument.
deltatest(data, clicks / pageviews ~ group)This is a relatively new way to express functions within a formula,
where the function is written on the right-hand side of the formula.
Specifically, you can write the function as
~ numerator / denominator. In this style, you must specify
the group column using the by argument.
deltatest(data, ~ clicks / pageviews, by = group)In this style, you can simply write
numerator / denominator. The input is parsed using R’s
non-standard evaluation (NSE) feature, and you must specify the group
column using the by argument.
deltatest(data, clicks / pageviews, by = group)All styles accept calculations. For example, if your data frame contains only columns for the positive count and negative count, you can express the metric as follows:
deltatest(data, pos / (pos + neg), by = group)group_namesFor this argument, list the two types of elements in the group column
in the order of control and treatment. By default, the function assumes
that the types are specified in dictionary order for this argument and
will display a message to that effect. To suppress the message, set the
quiet argument to TRUE.
typeBy default, deltatest tests the difference between two
groups. If you specify type = 'relative_change', it tests
the rate of change, i.e., \((\mu_{t} -
\mu_{c}) / \mu_{c}\) where \(\mu_c\) and \(\mu_t\) represent the mean values of the
control group and the treatment group, respectively.
The return value of deltatest is an object of class
htest.
result <- deltatest(data, clicks / pageviews, by = group)
result
#>
#>  Two Sample Z-test Using the Delta Method
#>
#> data:  clicks/pageviews by group
#> Z = 0.31437, p-value = 0.7532
#> alternative hypothesis: true difference in means between control and treatment is not equal to 0
#> 95 percent confidence interval:
#>  -0.01410593  0.01949536
#> sample estimates:
#>   mean in control mean in treatment        difference
#>       0.245959325       0.248654038       0.002694713
This object contains the estimates, the p-value, the confidence interval, and more.
result$estimate
#>   mean in control mean in treatment        difference
#>       0.245959325       0.248654038       0.002694713

result$p.value
#> [1] 0.7532436

result$conf.int
#> [1] -0.01410593  0.01949536
#> attr(,"conf.level")
#> [1] 0.95
For more details, refer to help(deltatest).