![]()
![]()
Framework for building modular Monte Carlo risk analysis models. It
extends the capabilities of mc2d to facilitate working with
multiple risk pathways, variates and scenarios. It provides tools to
organize risk analysis in independent flexible modules, align
multivariate mcnodes, automate the creation of mcnodes, visualise model
structure, assess convergence, and perform sensitivity analysis.
Install from CRAN:
install.packages("mcmodule")
library("mcmodule")
Install latest development version from GitHub.
# install.packages("devtools")
devtools::install_github("NataliaCiria/mcmodule")example_data <- data.frame(
category_1 = c("a", "b", "a", "b"), # Category 1 (e.g., type)
category_2 = c("blue", "blue", "red", "red"), # Category 2 (e.g., group)
x_min = c(0.07, 0.3, 0.2, 0.5), # Minimum value for parameter x
x_max = c(0.08, 0.4, 0.3, 0.6), # Maximum value for parameter x
y = c(0.01, 0.02, 0.03, 0.04) # Value for parameter y
)example_data_keys <- list(
example_data = list(
cols = names(example_data), # All columns in the data
keys = c("category_1", "category_2") # Unique identifiers for each row
)
)example_mctable <- data.frame(
mcnode = c("x", "y"), # Names of the nodes
description = c("Probability x", "Probability y"), # Descriptions
mc_func = c("runif", NA), # Distribution function for x, none for y
from_variable = c(NA, NA), # Source variable (not used here)
transformation = c(NA, NA), # Transformation (not used here)
sensi_analysis = c(FALSE, FALSE) # Include in sensitivity analysis
)example_exp <- quote({
result <- x * y # Calculate result as product of x and y
})eval_module(), creating the
stochastic nodes and evaluating the expressionexample_mcmodule <- eval_module(
exp = c(example = example_exp), # Model expression(s)
data = example_data, # Input data
mctable = example_mctable, # Node definitions
data_keys = example_data_keys # Data keys for matching
)# Summarize the 'result' node
mc_summary(example_mcmodule, "result")
# Get 'result' aggregated by category 1
example_mcmodule<-example_mcmodule%>%
agg_totals(
mc_name = "result",
agg_keys = c("category_1")
)
# Print aggregated 'result'
example_mcmodule$node_list$result_agg$summary
# visualise the mcmodule
mc_network(example_mcmodule, legend = TRUE)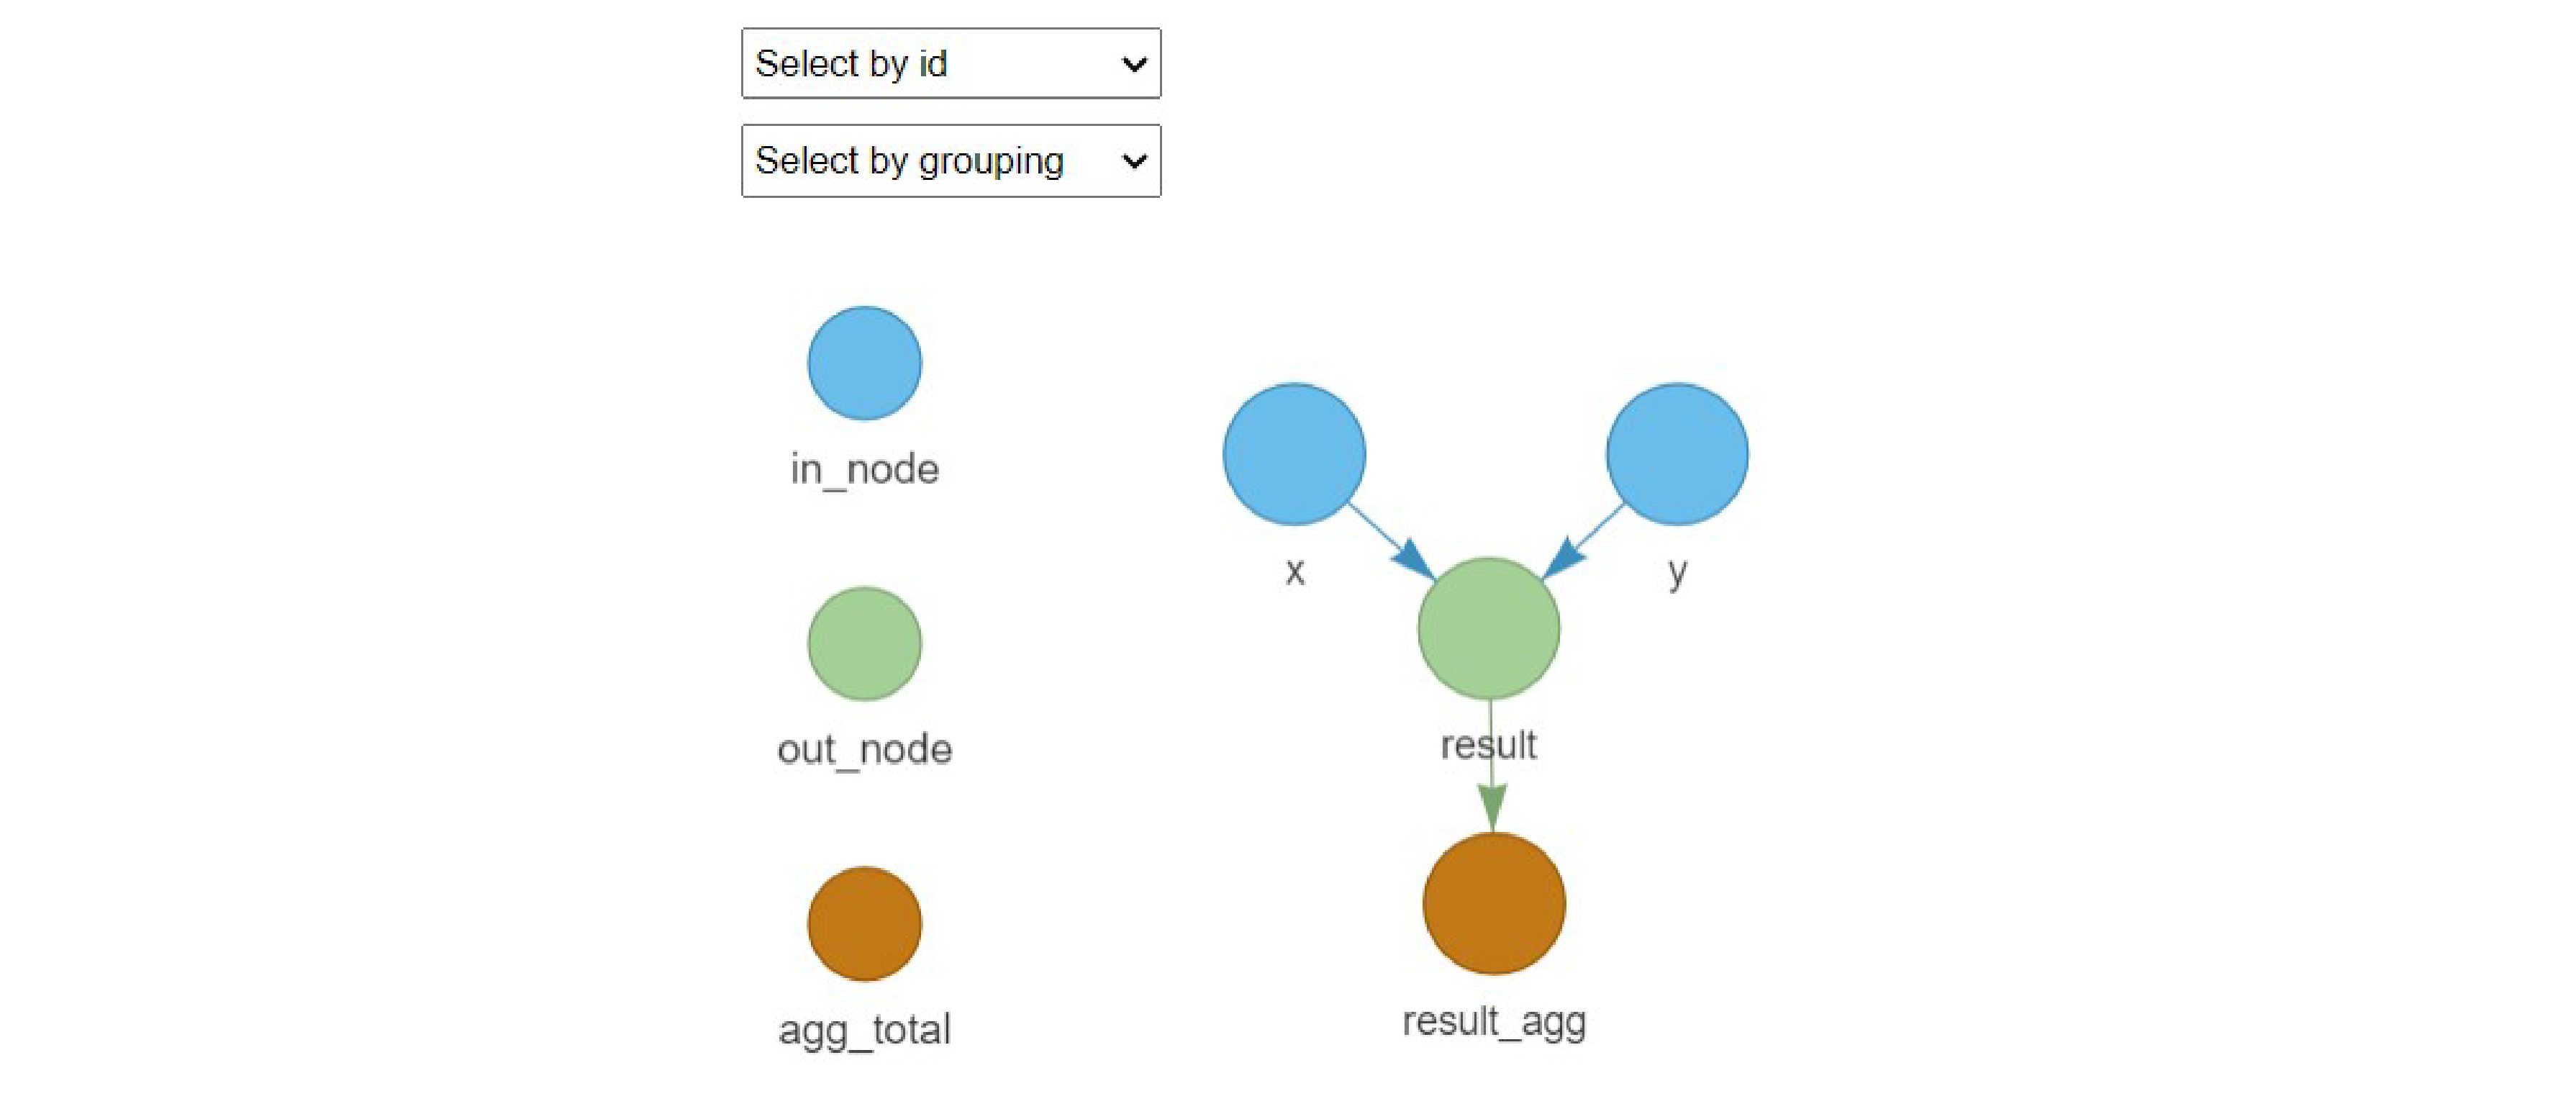
# Convergence analysis
exmaple_converg<-mcmodule_converg(example_mcmodule)

# Correlation analysis
exmaple_corr<-mcmodule_corr(example_mcmodule, output = "result_agg")
Further documentation and examples can be found in the vignette.
If you use mcmodule in your research, please cite:
Ciria N, Allepuz A, Ciaravino G (2026). mcmodule: Modular Monte Carlo Risk Analysis. R package version 1.3.0, https://nataliaciria.com/mcmodule/.
mcmodule was developed with support from:
BIOSECURE, a European Union’s HORIZON Europe FARM2FORK project
Views and opinions expressed are however those of the author(s) only and do not necessarily reflect those of the European Union or REA. Neither the European Union nor the granting authority can be held responsible for them.