![]()


![]()
BlackMarbleR is a R package that provides a simple way to use nighttime lights data from NASA’s Black Marble. Black Marble is a NASA Earth Science Data Systems (ESDS) project that provides a product suite of daily, monthly and yearly global nighttime lights. This package automates the process of downloading all relevant tiles from the NASA LAADS DAAC to cover a region of interest, converting and mosaicing the raw files (in HDF5 format) to georeferenced rasters.
The package can be installed via CRAN.
To install the development version from Github:
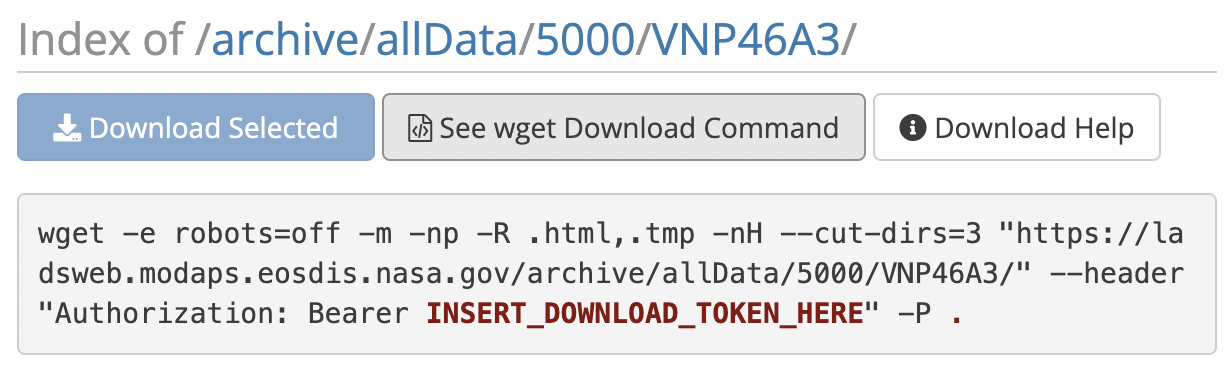
The function requires using a Bearer Token; to obtain a token, follow the below steps:
After logging in, the below will show the bearer token in red instead of INSERT_DOWNLOAD_TOKEN_HERE. Sometimes, after logging in, the NASA website will redirect to another part of the website. To obtain the bearer token, just navigate to the NASA LAADS Archive after logging in.
Before downloading and extracting Black Marble data, we first load packages, define the NASA bearer token, and define a region of interest.
#### Setup
# Load packages
library(blackmarbler)
library(geodata)
library(sf)
library(terra)
library(ggplot2)
library(tidyterra)
library(lubridate)

#### Define NASA bearer token
bearer <- "BEARER-TOKEN-HERE"

### ROI
# Define region of interest (roi). The roi must be (1) an sf polygon and (2)
# in the WGS84 (epsg:4326) coordinate reference system. Here, we use the
# getData function to load a polygon of Ghana
roi_sf <- gadm(country = "GHA", level=1, path = tempdir()) The below example shows making daily, monthly, and annual rasters of nighttime lights for Ghana.
### Daily data: raster for February 5, 2021
r_20210205 <- bm_raster(roi_sf = roi_sf,
                        product_id = "VNP46A2",
                        date = "2021-02-05",
                        bearer = bearer)

### Monthly data: raster for October 2021
r_202110 <- bm_raster(roi_sf = roi_sf,
                      product_id = "VNP46A3",
                      date = "2021-10-01", # The day is ignored
                      bearer = bearer)

### Annual data: raster for 2021
r_2021 <- bm_raster(roi_sf = roi_sf,
                    product_id = "VNP46A4",
                    date = 2021,
bearer = bearer)To extract data for multiple time periods, add multiple time periods to date. The function will return a SpatRaster object with multiple bands, where each band corresponds to a different date. The below code provides examples getting data across multiple days, months, and years.
#### Daily data in March 2021
r_daily <- bm_raster(roi_sf = roi_sf,
                     product_id = "VNP46A2",
                     date = seq.Date(from = ymd("2021-03-01"), to = ymd("2021-03-31"), by = "day"),
                     bearer = bearer)

#### Monthly aggregated data in 2021 and 2022
r_monthly <- bm_raster(roi_sf = roi_sf,
                       product_id = "VNP46A3",
                       date = seq.Date(from = ymd("2021-01-01"), to = ymd("2022-12-01"), by = "month"),
                       bearer = bearer)

#### Yearly aggregated data in 2012 and 2021
r_annual <- bm_raster(roi_sf = roi_sf,
                      product_id = "VNP46A4",
                      date = 2012:2021,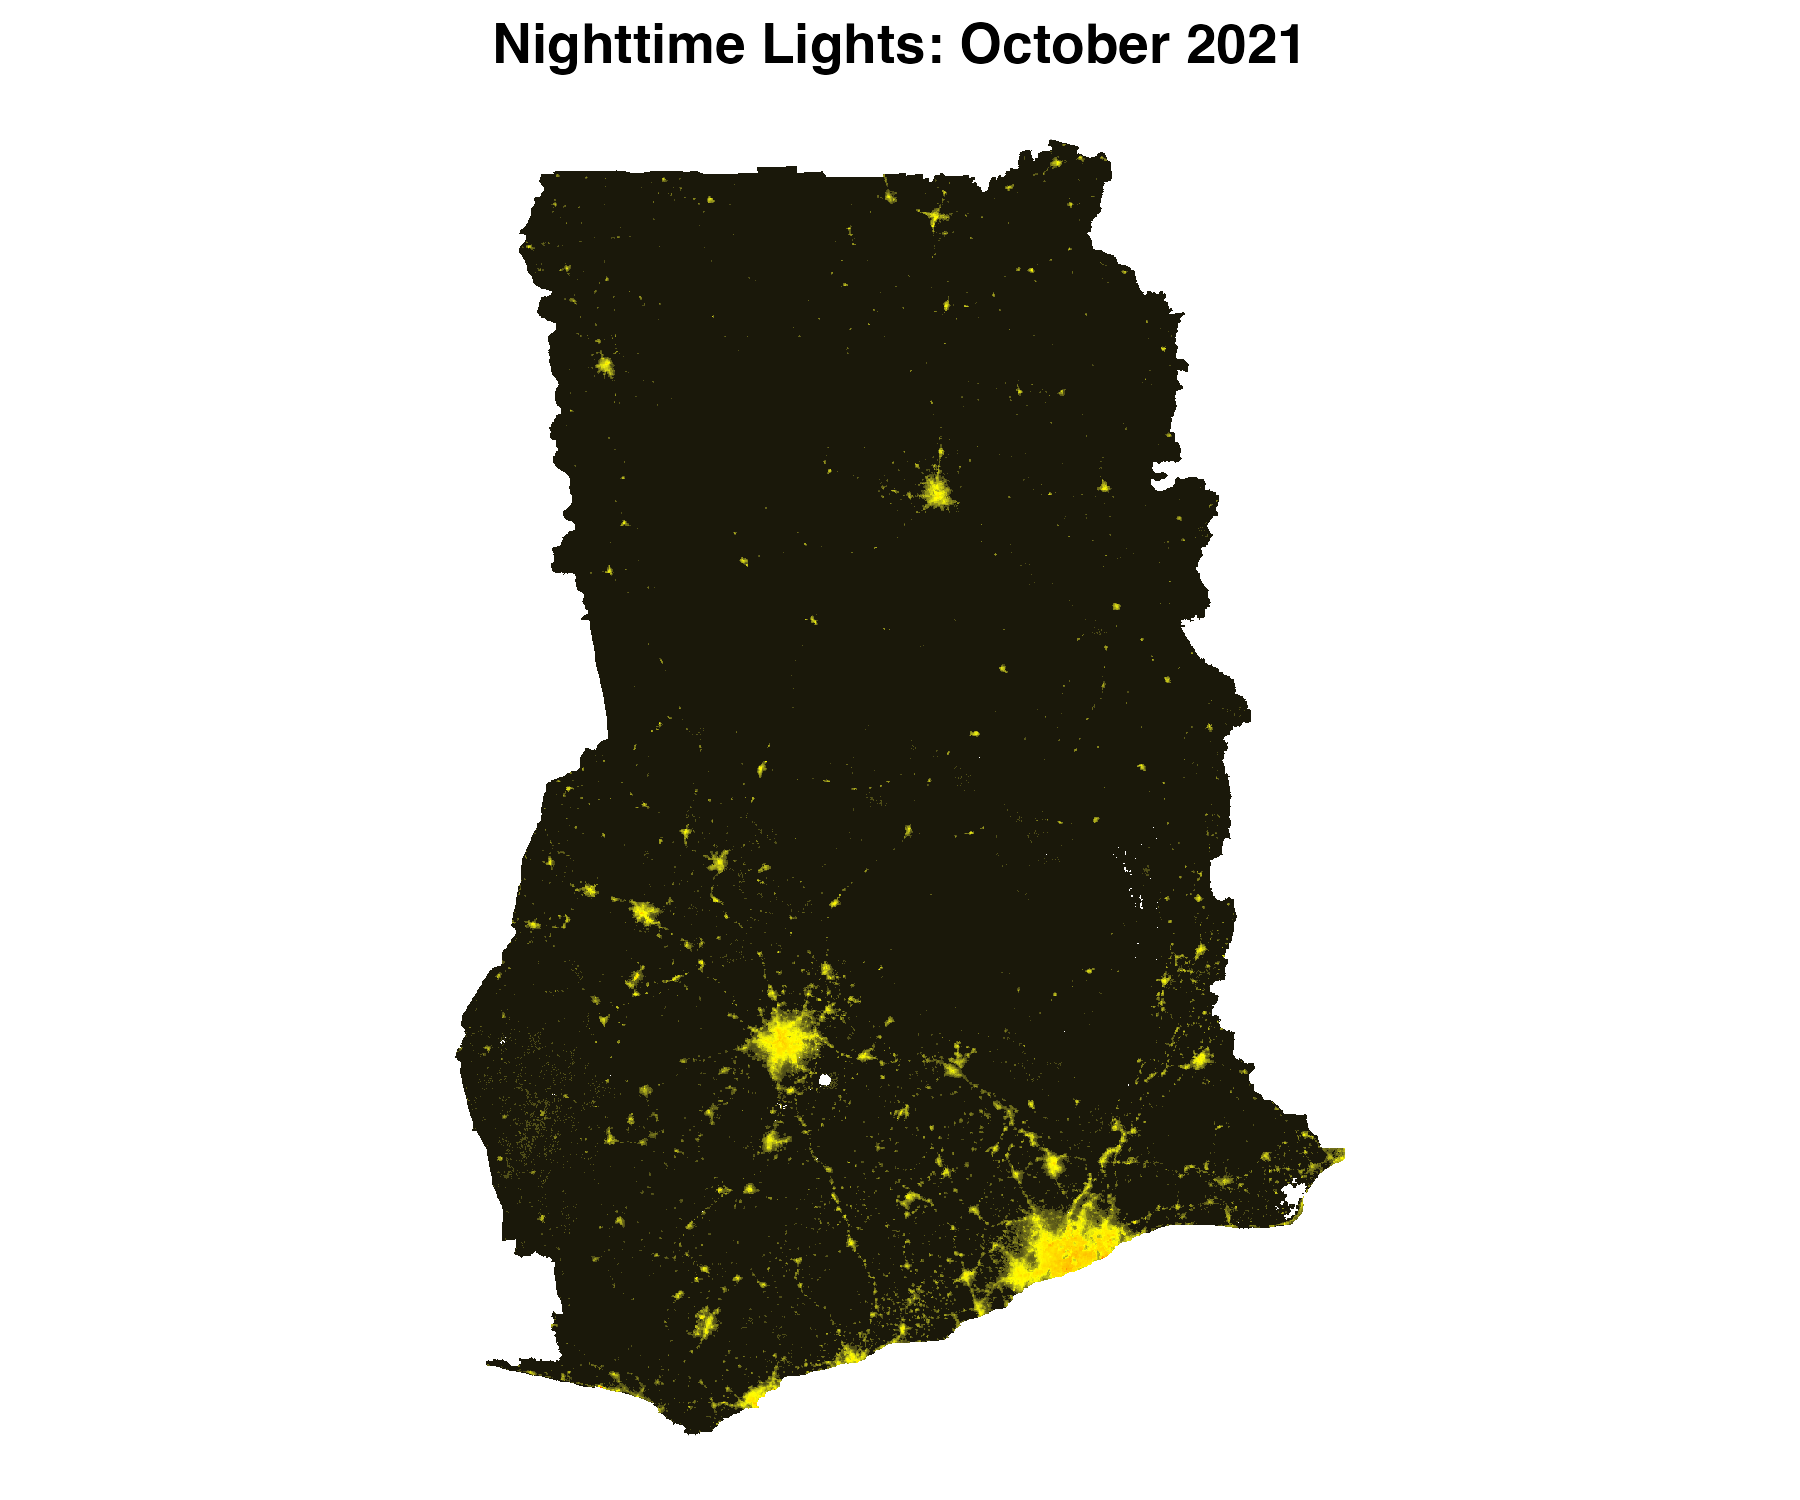
bearer = bearer)Using one of the rasters, we can make a map of nighttime lights
#### Make raster
r <- bm_raster(roi_sf = roi_sf,
               product_id = "VNP46A3",
               date = "2021-10-01",
               bearer = bearer)

#### Prep data
r <- r |> terra::mask(roi_sf)

## Distribution is skewed, so log
r[] <- log(r[] + 1)

##### Map
ggplot() +
  geom_spatraster(data = r) +
  scale_fill_gradient2(low = "black",
                       mid = "yellow",
                       high = "red",
                       midpoint = 4.5,
                       na.value = "transparent") +
  labs(title = "Nighttime Lights: October 2021") +
  coord_sf() +
  theme_void() +
  theme(plot.title = element_text(face = "bold", hjust = 0.5),
  legend.position = "none")
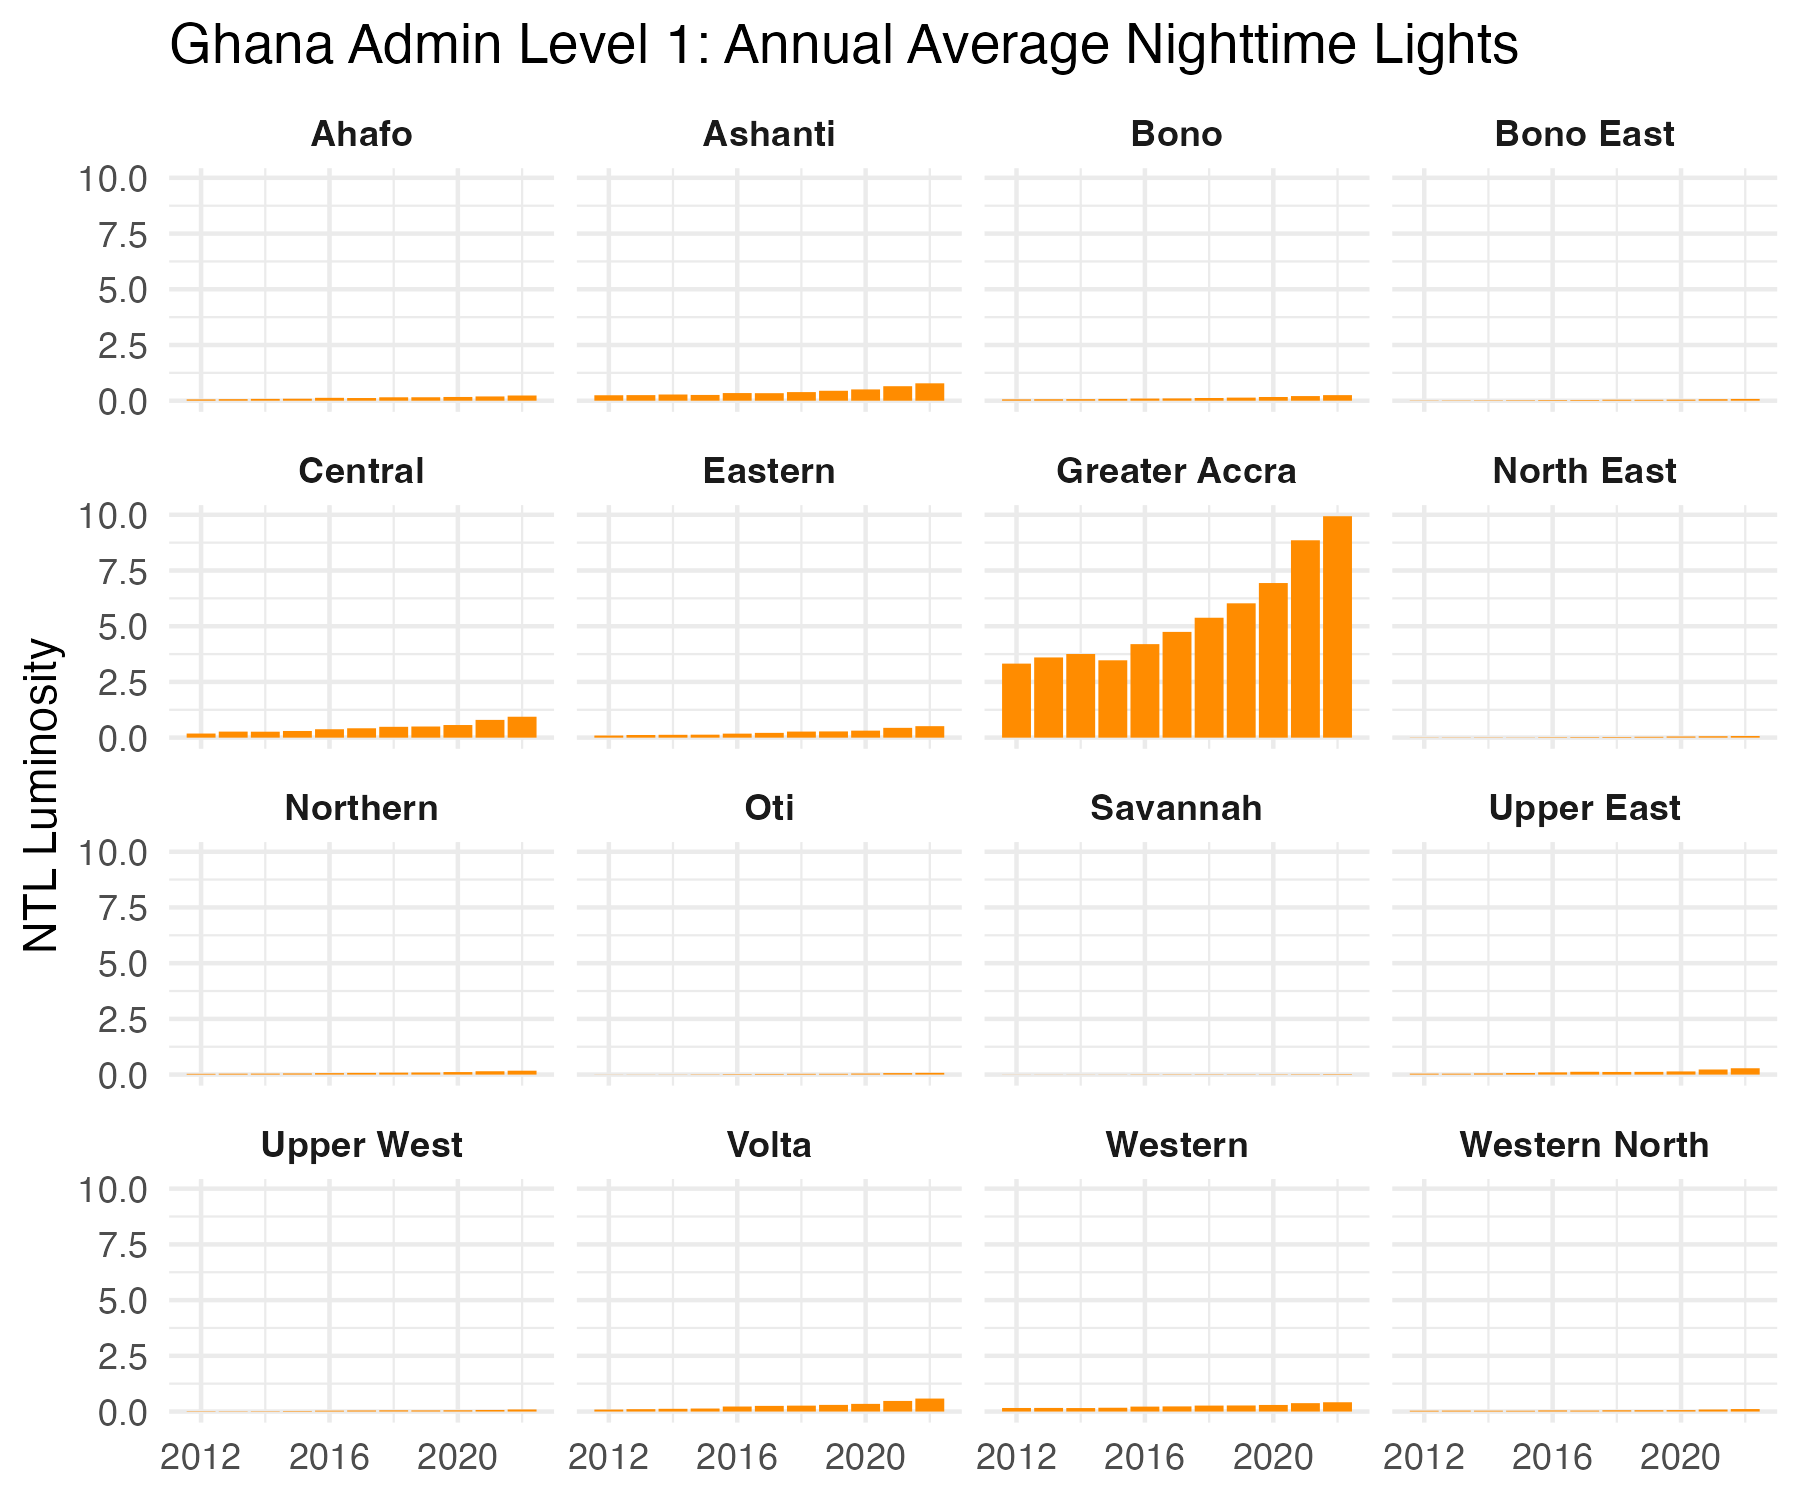
We can use the bm_extract function to observe changes in nighttime lights over time. The bm_extract function leverages the exactextractr package to aggregate nighttime lights data to polygons. Below we show trends in annual nighttime lights data across Ghana’s first administrative divisions.
#### Extract annual data
ntl_df <- bm_extract(roi_sf = roi_sf,
                     product_id = "VNP46A4",
                     date = 2012:2022,
                     bearer = bearer)

#### Trends over time
ntl_df |>
  ggplot() +
  geom_col(aes(x = date,
  y = ntl_mean),
  fill = "darkorange") +
  facet_wrap(~NAME_1) +
  labs(x = NULL,
       y = "NTL Luminosity",
       title = "Ghana Admin Level 1: Annual Average Nighttime Lights") +
  scale_x_continuous(labels = seq(2012, 2022, 4),
                     breaks = seq(2012, 2022, 4)) +
  theme_minimal() +
  theme(strip.text = element_text(face = "bold"))
Some users may want to monitor near-real-time changes in nighttime lights. For example, daily Black Marble nighttime lights data is updated regularly, where data is available roughly on a week delay; same use cases may require examining trends in daily nighttime lights data as new data becomes available. Below shows example code that could be regularly run to produce an updated daily dataset of nighttime lights.
The below code produces a dataframe of nighttime lights for each date, where average nighttime lights for Ghana’s 1st administrative division is produced. The code will check whether data has already been downloaded/extracted for a specific date, and only download/extract new data.
# Create directories to store data
dir.create(file.path(getwd(), "bm_files"))
dir.create(file.path(getwd(), "bm_files", "daily"))

# Extract daily-level nighttime lights data for Ghana's first administrative divisions.
# Save a separate dataset for each date in the `"~/Desktop/bm_files/daily"` directory.
# The code extracts data from January 1, 2023 to today. Given that daily nighttime lights
# data is produced on roughly a week delay, the function will only extract data that exists;
# it will skip extracting data for dates where data has not yet been produced by NASA Black Marble.
bm_extract(roi_sf = roi_sf,
           product_id = "VNP46A2",
           date = seq.Date(from = ymd("2023-01-01"), to = Sys.Date(), by = 1),
           bearer = bearer,
           output_location_type = "file",
           file_dir = file.path(getwd(), "bm_files", "daily"))

# Append daily-level datasets into one file
file.path(getwd(), "bm_files", "daily") |>
  list.files(pattern = "*.Rds",
  full.names = T) |>
  map_df(readRDS) |>
saveRDS(file.path(getwd(), "bm_files", "ntl_daily.Rds"))The package provides two functions.
bm_raster produces a raster of Black Marble nighttime lights.bm_extract produces a dataframe of aggregated nighttime lights to a region of interest (e.g., average nighttime lights within US States).Both functions take the following arguments:
roi_sf: Region of interest; sf polygon. Must be in the WGS 84 (epsg:4326) coordinate reference system. For bm_extract, aggregates nighttime lights within each polygon of roi_sf.
product_id: One of the following:
"VNP46A1": Daily (raw)"VNP46A2": Daily (corrected)"VNP46A3": Monthly"VNP46A4": Annualdate: Date of raster data. Entering one date will produce a SpatRaster object. Entering multiple dates will produce a SpatRaster object with multiple bands; one band per date.
product_ids "VNP46A1" and "VNP46A2", a date (eg, "2021-10-03").product_id "VNP46A3", a date or year-month (e.g., "2021-10-01", where the day will be ignored, or "2021-10").product_id "VNP46A4", year or date (e.g., "2021-10-01", where the month and day will be ignored, or 2021).bearer: NASA bearer token. For instructions on how to create a token, see here.
variable: Variable to used to create raster (default: NULL). For information on all variable choices, see here; for VNP46A1, see Table 3; for VNP46A2 see Table 6; for VNP46A3 and VNP46A4, see Table 9. If NULL, uses the following default variables:
product_id "VNP46A1", uses DNB_At_Sensor_Radiance_500m.product_id "VNP46A2", uses Gap_Filled_DNB_BRDF-Corrected_NTL.product_ids "VNP46A3" and "VNP46A4", uses NearNadir_Composite_Snow_Free.quality_flag_rm: Quality flag values to use to set values to NA. Each pixel has a quality flag value, where low quality values can be removed. Values are set to NA for each value in ther quality_flag_rm vector. (Default: NULL).
VNP46A1 and VNP46A2 (daily data):
0: High-quality, Persistent nighttime lights1: High-quality, Ephemeral nighttime Lights2: Poor-quality, Outlier, potential cloud contamination, or other issuesVNP46A3 and VNP46A4 (monthly and annual data):
0: Good-quality, The number of observations used for the composite is larger than 31: Poor-quality, The number of observations used for the composite is less than or equal to 32: Gap filled NTL based on historical dataTRUE, skips cases where not all tiles are available. (Default: TRUE).NA values in rasters using the terra::approximate function. Additional arguments for the terra::approximate function can also be passed into bm_raster/bm_extract (eg, method, rule, f, ties, z, NA_rule). (Default: FALSE).h5_dir: Black Marble data are originally downloaded as h5 files. If h5_dir = NULL, the function downloads to a temporary directory then deletes the directory. If h5_dir is set to a path, h5 files are saved to that directory and not deleted. The function will then check if the needed h5 file already exists in the directory; if it exists, the function will not re-download the h5 file.
output_location_type: Where output should be stored (default: r_memory). Either:
r_memory where the function will return an output in Rfile where the function will export the data as a file. For bm_raster, a .tif file will be saved; for bm_extract, a .Rds file will be saved. A file is saved for each date. Consequently, if date = c(2018, 2019, 2020), three datasets will be saved: one for each year. Saving a dataset for each date can facilitate re-running the function later and only downloading data for dates where data have not been downloaded.If output_location_type = "file", the following arguments can be used:
NULL, so the working directory will be used)[file_prefix][product_id]_t[date].[tif/Rds]TRUE). If the function is first run with date = c(2018, 2019, 2020), then is later run with date = c(2018, 2019, 2020, 2021), the function will only download/extract data for 2021. Skipping existing files can facilitate re-running the function at a later date to download only more recent data.file_return_null: Whether to return NULL instead of a output to R (SpatRaster or dataframe). When output_location_type = 'file', the function will export data to the file_dir directory. When file_return_null = FALSE, the function will also return the queried data—so the data is available in R memory. Setting file_return_null = TRUE, data will be saved to file_dir but no data will be returned by the function to R memory (default: FALSE).
…: Additional arguments for terra::approximate, if interpol_na = TRUE
bm_extract only "mean"). The exact_extract function from the exactextractr package is used for aggregations; this parameter is passed to fun argument in exactextractr::exact_extract.TRUE, it adds three values: n_non_na_pixels (the number of non-NA pixels used for computing nighttime light statistics); n_pixels (the total number of pixels); and prop_non_na_pixels the proportion of the two. (Default: TRUE).For more information on NASA Black Marble, see: